Automatic counting on aerial images: strawberry flowers

Automatic counting on aerial images: strawberry flowers
Growing and harvesting strawberries is a labour-intensive activity complicated by the unpredictable and variable yield of strawberry plants. Yield prediction is therefore an important aspect when cultivating strawberries for logistical reasons, such as providing sufficient staff, transport, packaging, and storage. In this article, you will read how drone data can be used to perform automatic harvest prediction.
Several studies have shown that flower count is a good measure to predict strawberry yields: a flower today is, on average, a ripe strawberry 3 weeks later. However, flower counting is also labour-intensive and impossible to carry out for large areas. In turn, selectively counting small areas to then extrapolate those counts over the entire field is very sensitive to naturally occurring variations in the growth and flowering of these plants, caused by minute differences in temperature, lighting, irrigation, fertilisation and substrate, among others.
However, with modern artificial intelligence techniques for image processing, it is possible to automate the counting of strawberry flowers. The use of drones (automated or not) to capture the images for these counts allows fast and efficient processing of large areas, and generation of detailed harvest forecasts for entire fields. Furthermore, these techniques also generate additional information, such as density maps for flowering flowers and their evolution over time, which can be indispensable information for optimisation of growth (fertilisation, watering, ...).
Collecting data
To develop and test these artificial intelligence methods, we initially need enough data on strawberry growth and flowering. In this, we were assisted by Proefcentrum Fruitteelt VZW, which has experimental fields for strawberry cultivation. The main focus here was on 5 rows of strawberry plants, each 50m long and about 150 plants per row. These plants are all of the same variety "Varity", but have undergone different treatments so that local differences in growth stages are present.
Several shots of this experimental field were taken with drones over 15 weeks during the flowering and harvesting of strawberries. These images were also taken with different altitudes ranging from 2 to 20m height, in different weather conditions, and outdoors and indoors in greenhouses. Each time, flowers from the same 12 selections of 30 plants were also manually counted, in order to obtain a ground truth and validate the automatically counted quantities.
Drone image collection and initial data processing were carried out by an external drone company (Didex). The images obtained show a large overlap and were merged into one large orthographic photograph. An example of such an orthophoto of the 5 rows of 50m long is given below. Note that this is a greatly reduced version, and that the original image has a very high resolution.
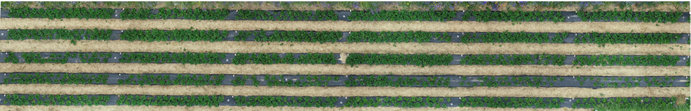
A merged and rectified orthophoto. The full image has 3600 x 22500 pixels.
Selection of the algorithm
Automated counting of people or objects in images is a common and popular problem in image processing, with a rich literature and many different approaches and algorithms. Recent overviews can be found in the following links:
- CNN-based Density Estimation and Crowd Counting: A Survey. https://arxiv.org/pdf/2003.12783.pdf .
- A Survey of Recent Advances in CNN-based Single Image Crowd Counting and Density Estimation. https://arxiv.org/pdf/1707.01202.pdf
- Convolutional-Neural Network-Based Image Crowd Counting: Review, Categorisation, Analysis, and Performance Evaluation. https://www.ncbi.nlm.nih.gov/pmc/articles/PMC6983207/
From these overviews, it is clear that there are hundreds of recent papers dealing with counting people or objects. One class of methods that recurs frequently and systematically achieves good results is based on a convolutional neural network (CNN). This type of neural network has become very popular within artificial intelligence over the last decade, and also forms the basis of many recent developments such as deep learning. Since there are also many possibilities within the class of CNN-based counting methods, we have chosen a relatively simple method that still gives good results and is often cited in the literature: https://www.cs.tau.ac.il/~wolf/papers/learning-count-cnn.pdf
Annotation and flower density
Algorithms based on CNN are supervised algorithms for most applications. This means that the algorithm tries to learn from examples, and will mimic what it has seen during a training phase. So initially, it is necessary to generate a large amount of examples of what is expected from the network, called the training set. In our case, the training set will consist of a picture as input, and a count as output. However, this can be approached in many ways.
First, we need to decide on the size of the images. Processing a gigantic photo in one go is not expedient, and typically in these techniques, one will automatically divide a large photo into small pieces of the same size. The total sum over the whole photo is then the sum of the counts in the individual pieces.
Furthermore, we need to build a ground truth, and this requires manually annotating a large number of photos. This labour-intensive task can be made more pleasant by using annotation software. This annotation can also be done in different ways: for example, one can indicate the number of flowers in each photo, one can indicate each flower with a single click in the centre of the flower (dot annotation), or one can indicate each flower with a square, which then also gives information about the size of the flower (box annotation). For the implemented algorithm, point annotation suffices.
An additional problem of annotation is that it is not unique. If the same image were to be annotated twice, the result will vary slightly. With point annotation, for example, the coordinates of each point will not match exactly, and small displacements of the points will still produce a valid annotation. Therefore, it is not desirable to learn the exact coordinates of each point, but rather the concept that there are one or more points in that vicinity. Thus, we wish rather to learn a point density. In practice, this can be obtained by blurring the points with a Gaussian function that transforms a point distribution into a density function. This is less sensitive to small displacements or differences in annotation, while we can still perform a count: The sum of the density over all pixels will still yield the same number as the initial point annotation.
An example of this annotation process is shown below. See also the article on annotation in the EUKA drone-tech blog here: https://euka.flandersmake.be/dataverzameling-voor-ai-waarom-diversiteit-van-beeldmateriaal-zo-belangrijk-is/
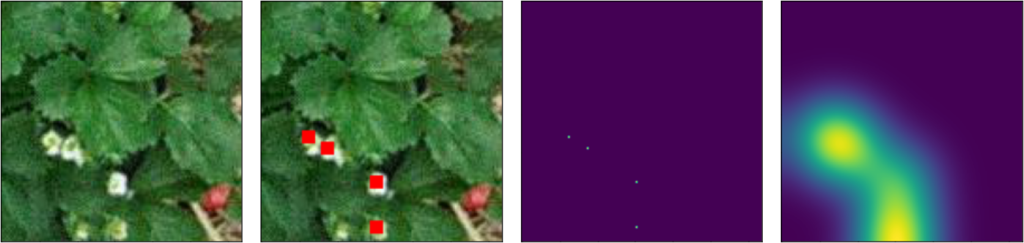
From left to right: An image from the data set for annotation. The manually annotated image where 4 flowers are marked. The resulting logical image with the coordinates of each annotation. And finally the point cloud reduced to a density map via a Gaussian function. The sum over the whole image is still 4, but the exact location of each point is less important
A qualitative and large data set is very important, given that the network can only learn relationships that are also present in the training set. However, one has to make the practical trade-off of increasing the training data versus its cost in terms of acquisition of the images and working hours for processing, annotation and storage. A well-known technique for enlarging the training data in a cheap way is data "augmentation": With applies simple geometric operations, such as mirroring, scaling and rotating, which produce new images whose output can also be calculated without human intervention. Note that in the example here, the output is a density function, and so the geometric operations must also be applied to the output.
An example of such augmented data and corresponding output is given in the figures below. This is also the input and output with which the network will be trained.
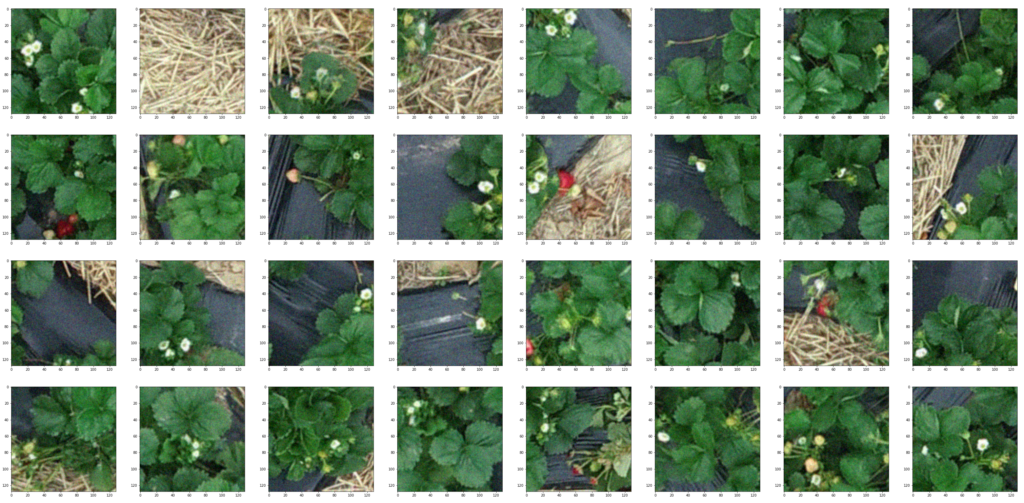
32 typical frames of size 128×128 pixels from the training set.
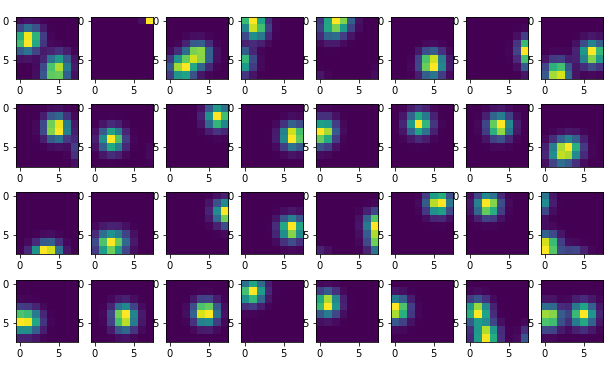
The corresponding output as 8×8 density images
The convolutional neural network
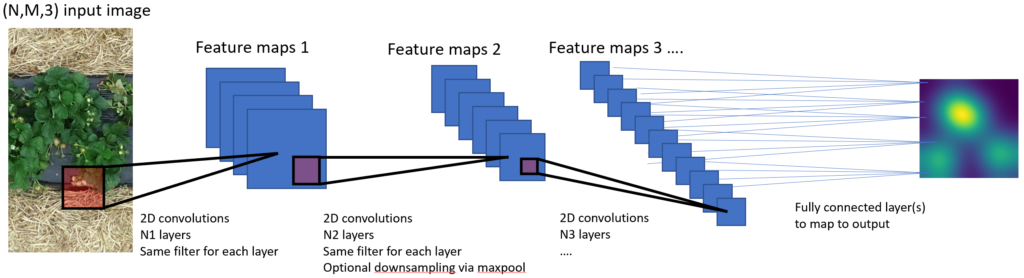
A convolutional neural network usually consists of a sequence of layers, where the output of each layer is the input of the next layer. There are several types of layers, the most important of which are the convolutional layers (this is where a CNN gets its name). A convolutional layer takes a spatial input, such as a small piece of a picture, and applies different filters to it. The output of each filter forms a characteristic or "feature", and so the number of features in a convolutional layer is the same as the number of filters in that layer. Typical filters are going to respond to certain shapes, colours, edges or patterns, and each feature map will thus provide a spatial description of how strongly those features are present in the photo.
These convolutional layers follow each other sequentially, and the filters and features in each layer thus become more complex, abstract and with a larger spatial range. Other layers sometimes alternate the convolutional layers, for example pooling layers that reduce resolution or fully connected layers to connect to an output layer. During the learning process, input-output pairs are presented, and the internal parameters of the network, such as the various filters in the convolutional layers, are adjusted so that the network's output differs as little as possible from the desired output. The hope is that the network will thus learn to recognise the essential patterns to solve the problem, and will thus be able to apply them to images that are new.
While training a neural network is an intensive task and can require hours to days of processor time, the practical use of such a network is much less intensive. Once trained, the network can be deployed quickly and efficiently in practical scenarios: Counting thousands of flowers spread over hundreds of square metres can be done in a span of seconds.
Results
As an example, we have annotated a full photo with 5 rows of 50m strawberry plants. This flight took place on an overcast day at 10m altitude. A total of 741 flowers were indicated. The photo was then cut into two parts, one of which was used for training the CNN, and the other, unseen, part was used for testing the trained network.
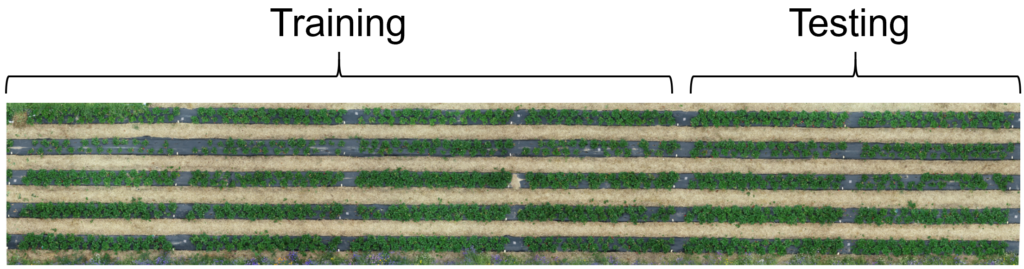
The full orthophoto, with designated trainigngs and test section.
After training the network, we check its performance on the test image. This performance can be validated in two ways:
- Visual inspection of the generated flower densities, and comparison with the observed flowers. This can be simplified by placing the density image as a layer over the original image.
- Comparing the number of flowers counted by the CNN with the annotated number.
For the first method, the images below can be used. On the left is the test image, on the right the generated flower densities as a red layer over a greyscale version of the colour image. Visually, it can indeed be verified that the similarity is very good. A zoomed-in version, on which the annotation is also indicated in green, is also given.
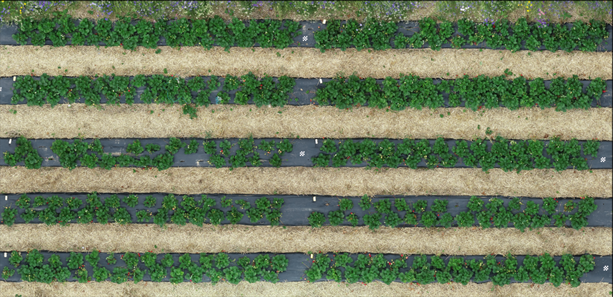
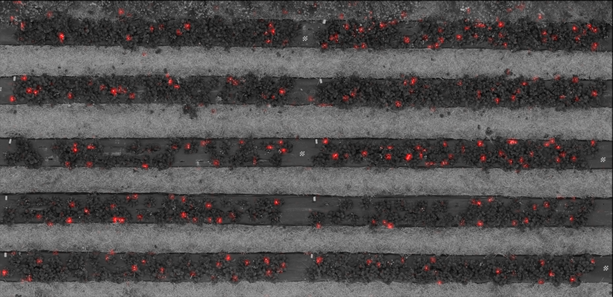
The test image as an RGB image (top), and the flower density as a red layer over a monochrome version of the test image (bottom).
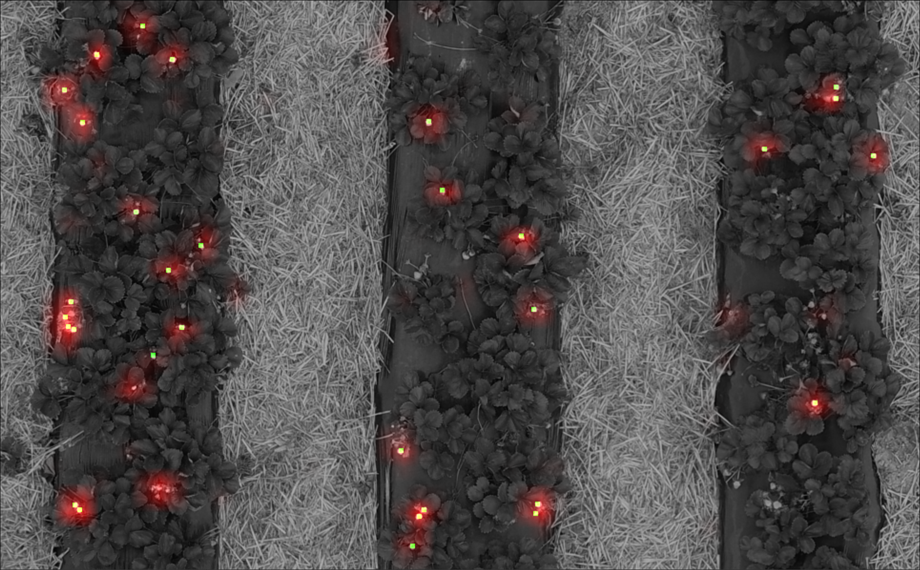
A zoomed-in selection of the flower density and test image. To check, the flowers were also manually annotated, this is indicated by green dots. Clearly, the match is good.
The number of flowers counted by the CNN is 267, while the number of flowers counted manually is 254. So the agreement between the two results is very good. Further tests on similar images, and comparison with ground truth confirm this behaviour.
CNN-based counting methods thus allow us to quickly and automatically perform counts of objects in photographs, which we demonstrated here with counting strawberry flowers in photographs taken with drones. The bottleneck in this process is not image processing: Composite photos that include entire fields of thousands of flowers can be counted within seconds on a standard laptop. Properly collecting and processing the image data embraces most of the processing time.
This article was published first at EUKA Drone Tech Blog